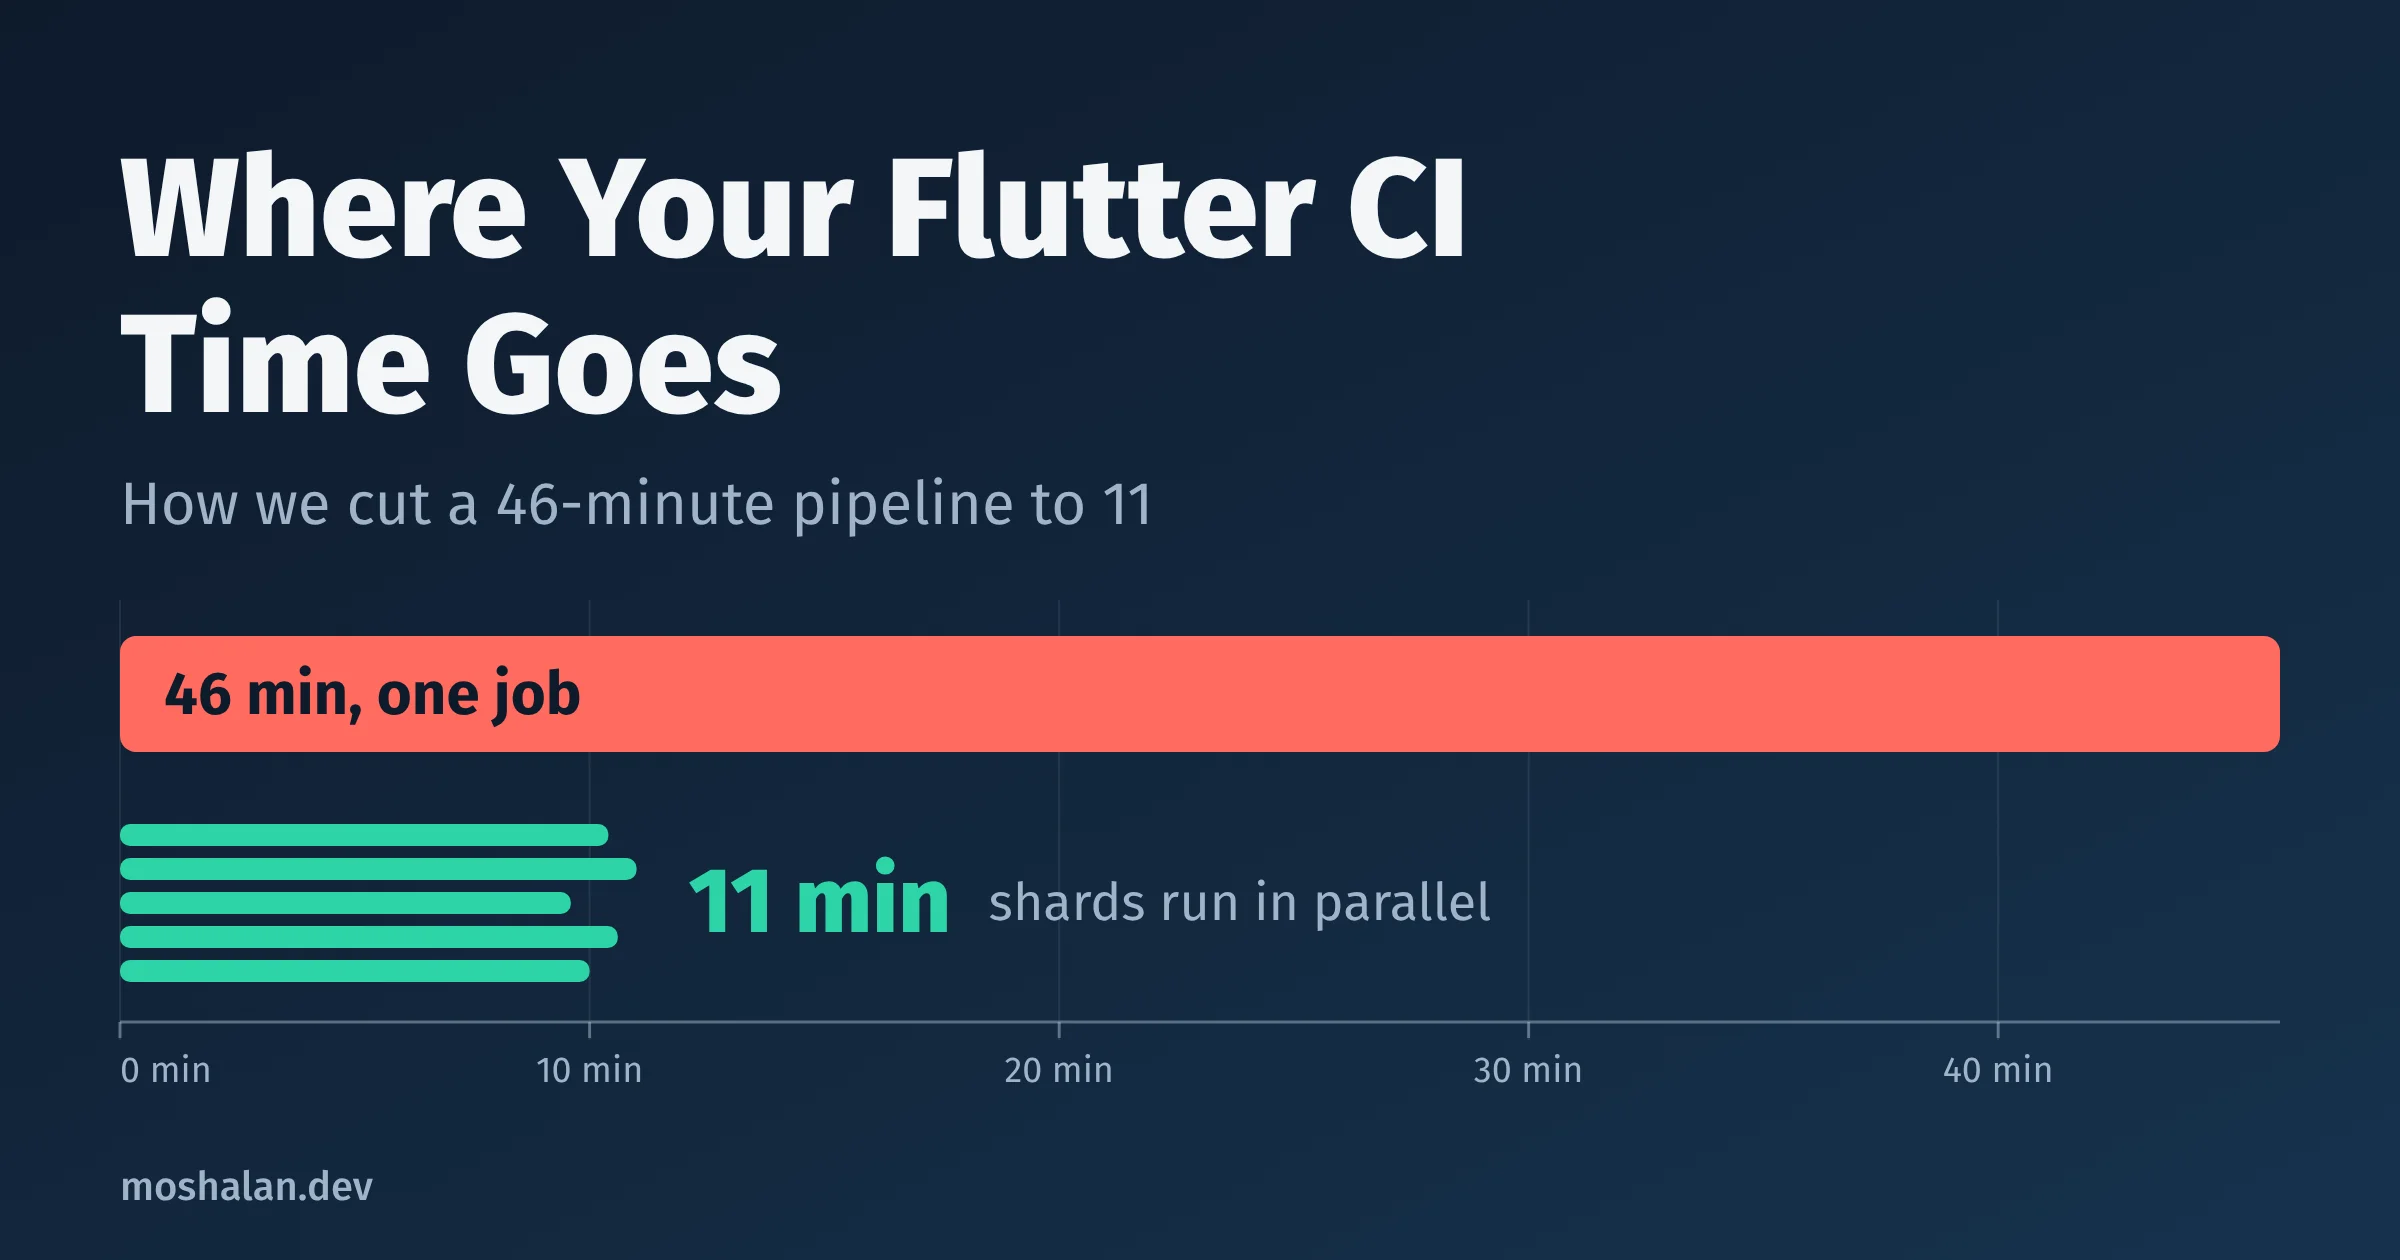
AI is speeding up how fast we write code, but are your PRs still stuck in the slow lane?
Our Flutter project’s pipeline took 47 minutes per pull request (PR) to turn green. We brought it down to 12 minutes and cut the monthly cost by 36%.
I’ll show how we found the bottlenecks in our pipeline and which fixes saved the most time.
This post is for engineers who maintain a Flutter pipeline, on any CI provider, and want faster feedback on their PRs. You’ll need a working pipeline that already runs analysis, tests, and builds.
We run on GitHub Actions, but none of the fixes depend on it, so I’ll skip the YAML and stick to the approach.
Problem
Every PR has to pass two required checks before merging: Coding style and Tests. Over the last 30 days, the median run time for Tests was 47 minutes, and for Coding style it was 14 minutes.
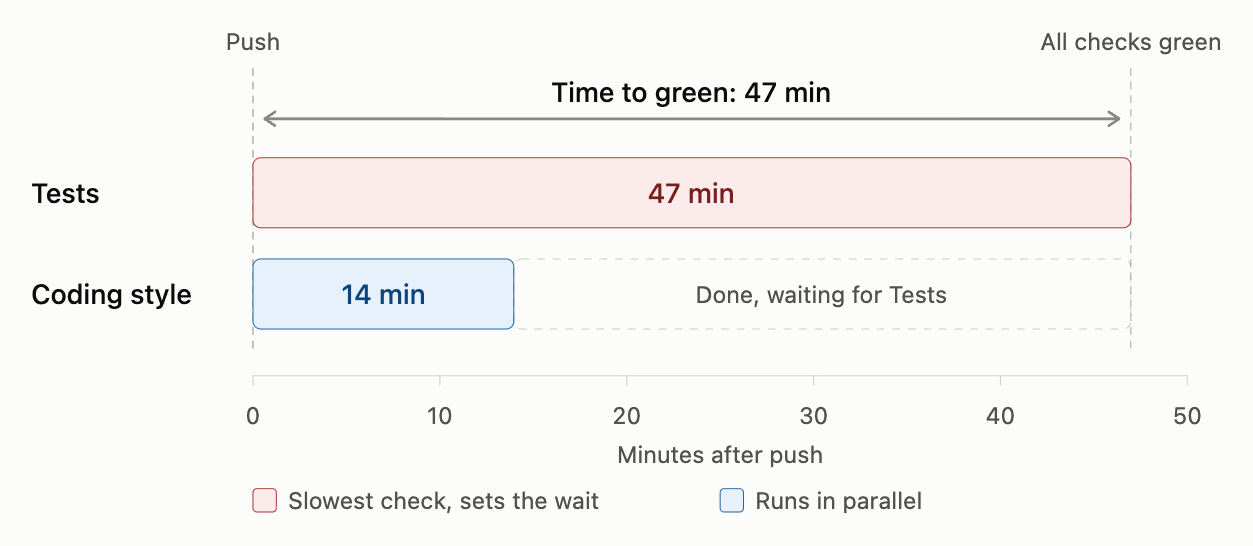
Of our 1,450 test files, only the 466 golden test files needed a Mac. We ran the whole suite on expensive Mac runners anyway, just to keep those 466 happy, and paid for it in both time and money.
Measure before changing anything
We pulled every non-skipped test run from a 30-day window through our CI provider’s API, then read the duration of each job and step. Every provider exposes this data through an API or an export. For each run, you need the ID, the outcome, and the start and end time of every job and step.
Here’s what it looked like with the GitHub CLI:
# All runs in the window (repeat for each workflow)
gh api "repos/OWNER/REPO/actions/workflows/tests.yml/runs?created=start_date..end_date&per_page=100" --paginate \
  -q '.workflow_runs[] | select(.conclusion!="skipped") | [.id, .conclusion] | @tsv'

# Jobs and steps for one run (duration = completed_at - started_at)
gh api "repos/OWNER/REPO/actions/runs/<run_id>/jobs?per_page=50"
Here is where the 47 minutes went:
| Step | Median time |
|---|---|
| Test step (all test files, one runner) | 36.25 minutes (47 minutes minus the preparation step and coverage minutes) |
| Prepare step | 6 minutes |
| Coverage | 4.75 minutes |
The test step was the obvious target, but the numbers didn’t explain why it took 36.25 minutes. So we looked at what flutter test does for each file. It compiles the file into its own kernel and boots a separate flutter_tester isolate (Dart’s unit of execution) for it. Our test config also loads the app fonts once per file. On the 5-core CI runner, that came to about 1.5 seconds per file.
Most of the 36 minutes went to starting up 1,450 times, not to running the tests themselves.
The approach
Two rules:
- Fix the biggest step first.
- Measure every approach you apply before committing to it on a throwaway CI branch.
We also ruled out deleting tests to make CI faster. App quality stays where it is.
The fixes ranked by impact
Fix 1: Run the tests that don’t need macOS on Linux
The whole suite ran on a Mac because 466 files needed one. The other 980 didn’t. We rendered the golden reference images on macOS, and Linux draws text slightly differently, so the golden tests would fail on Linux. No other test should care which operating system it runs on.
We checked before building anything. A throwaway branch ran both halves in parallel on the real runners.
| Job | Runner | Files | Tests | Job total |
|---|---|---|---|---|
| Golden files | Mac | 466 | 578 | 13 min |
| Everything else | Linux, 2 cores | 980 | 3,016 | 47 min |
All 3,016 non-golden tests passed on Linux (980 files, since one file holds several tests). No test failed only on Linux.
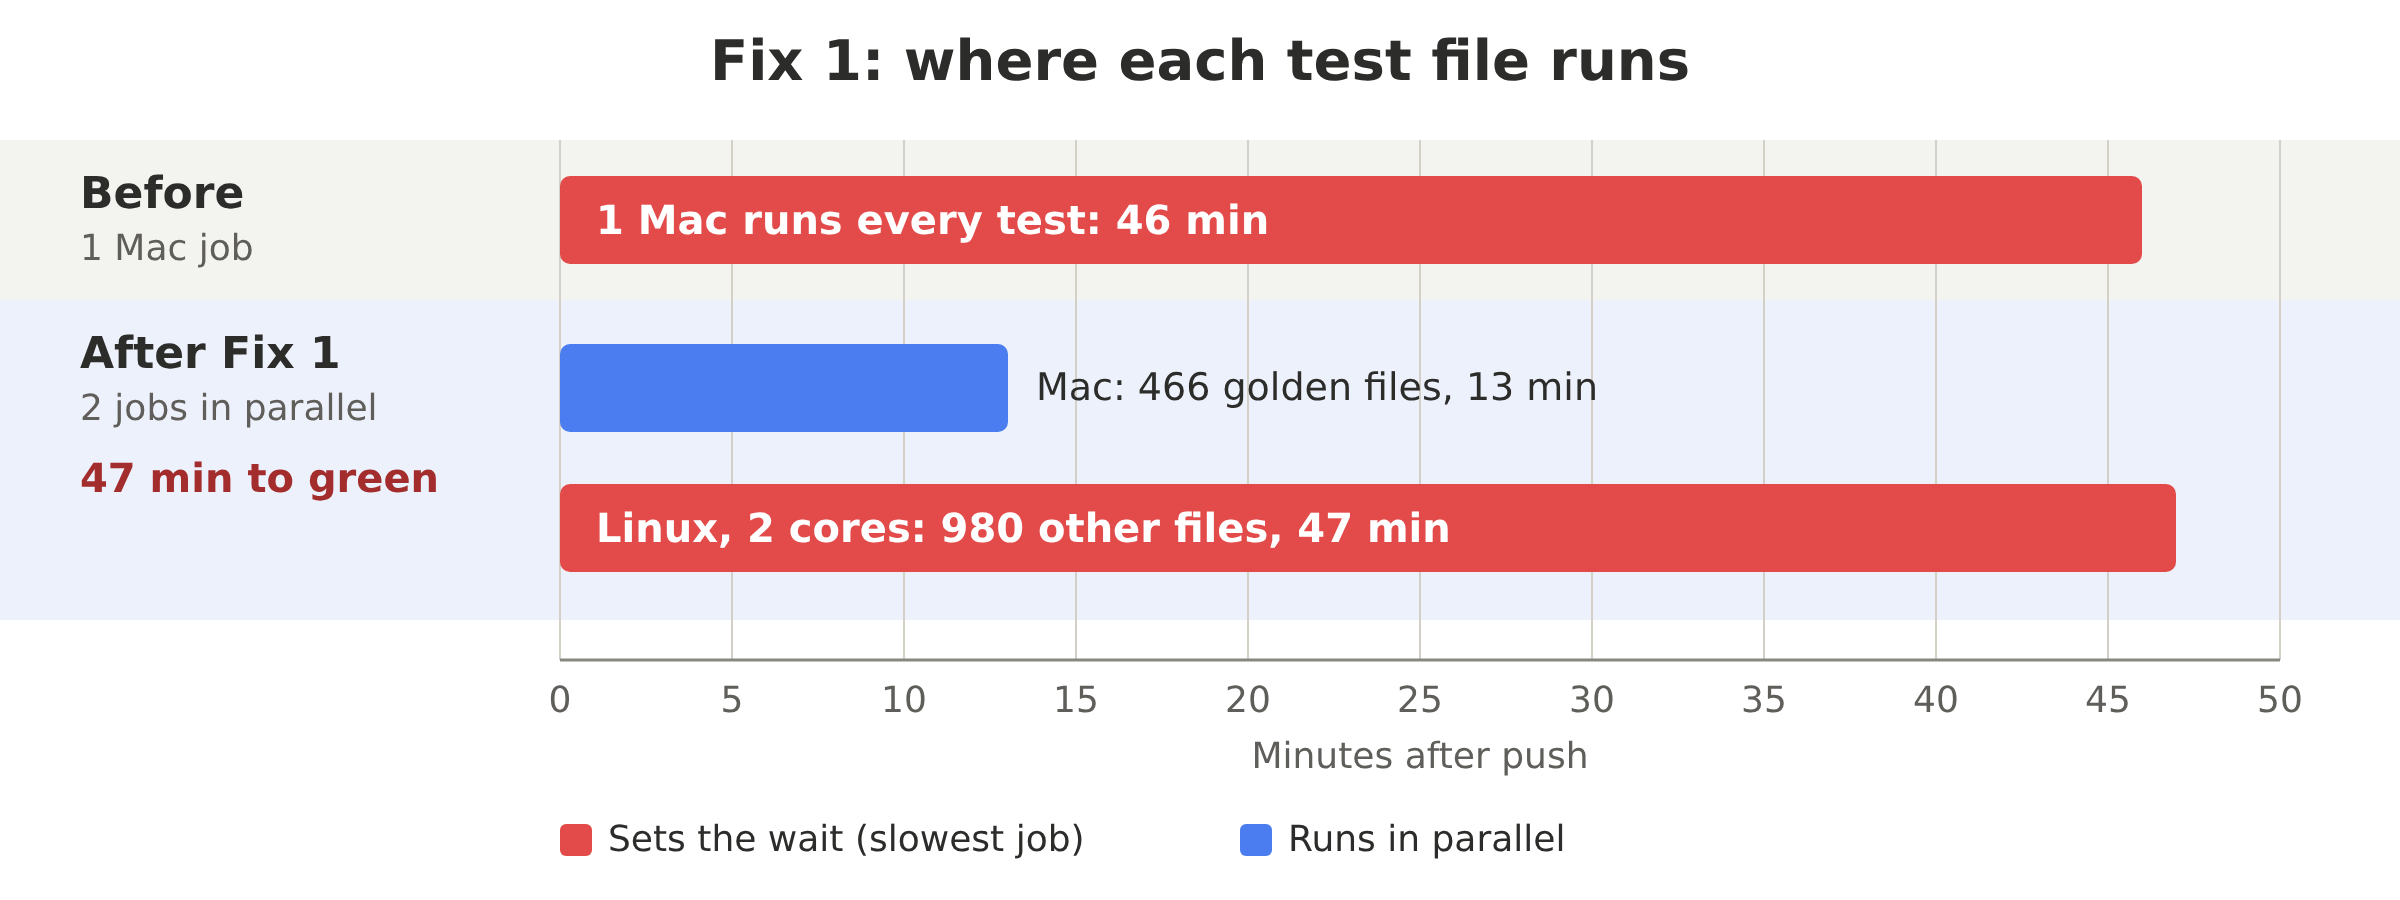
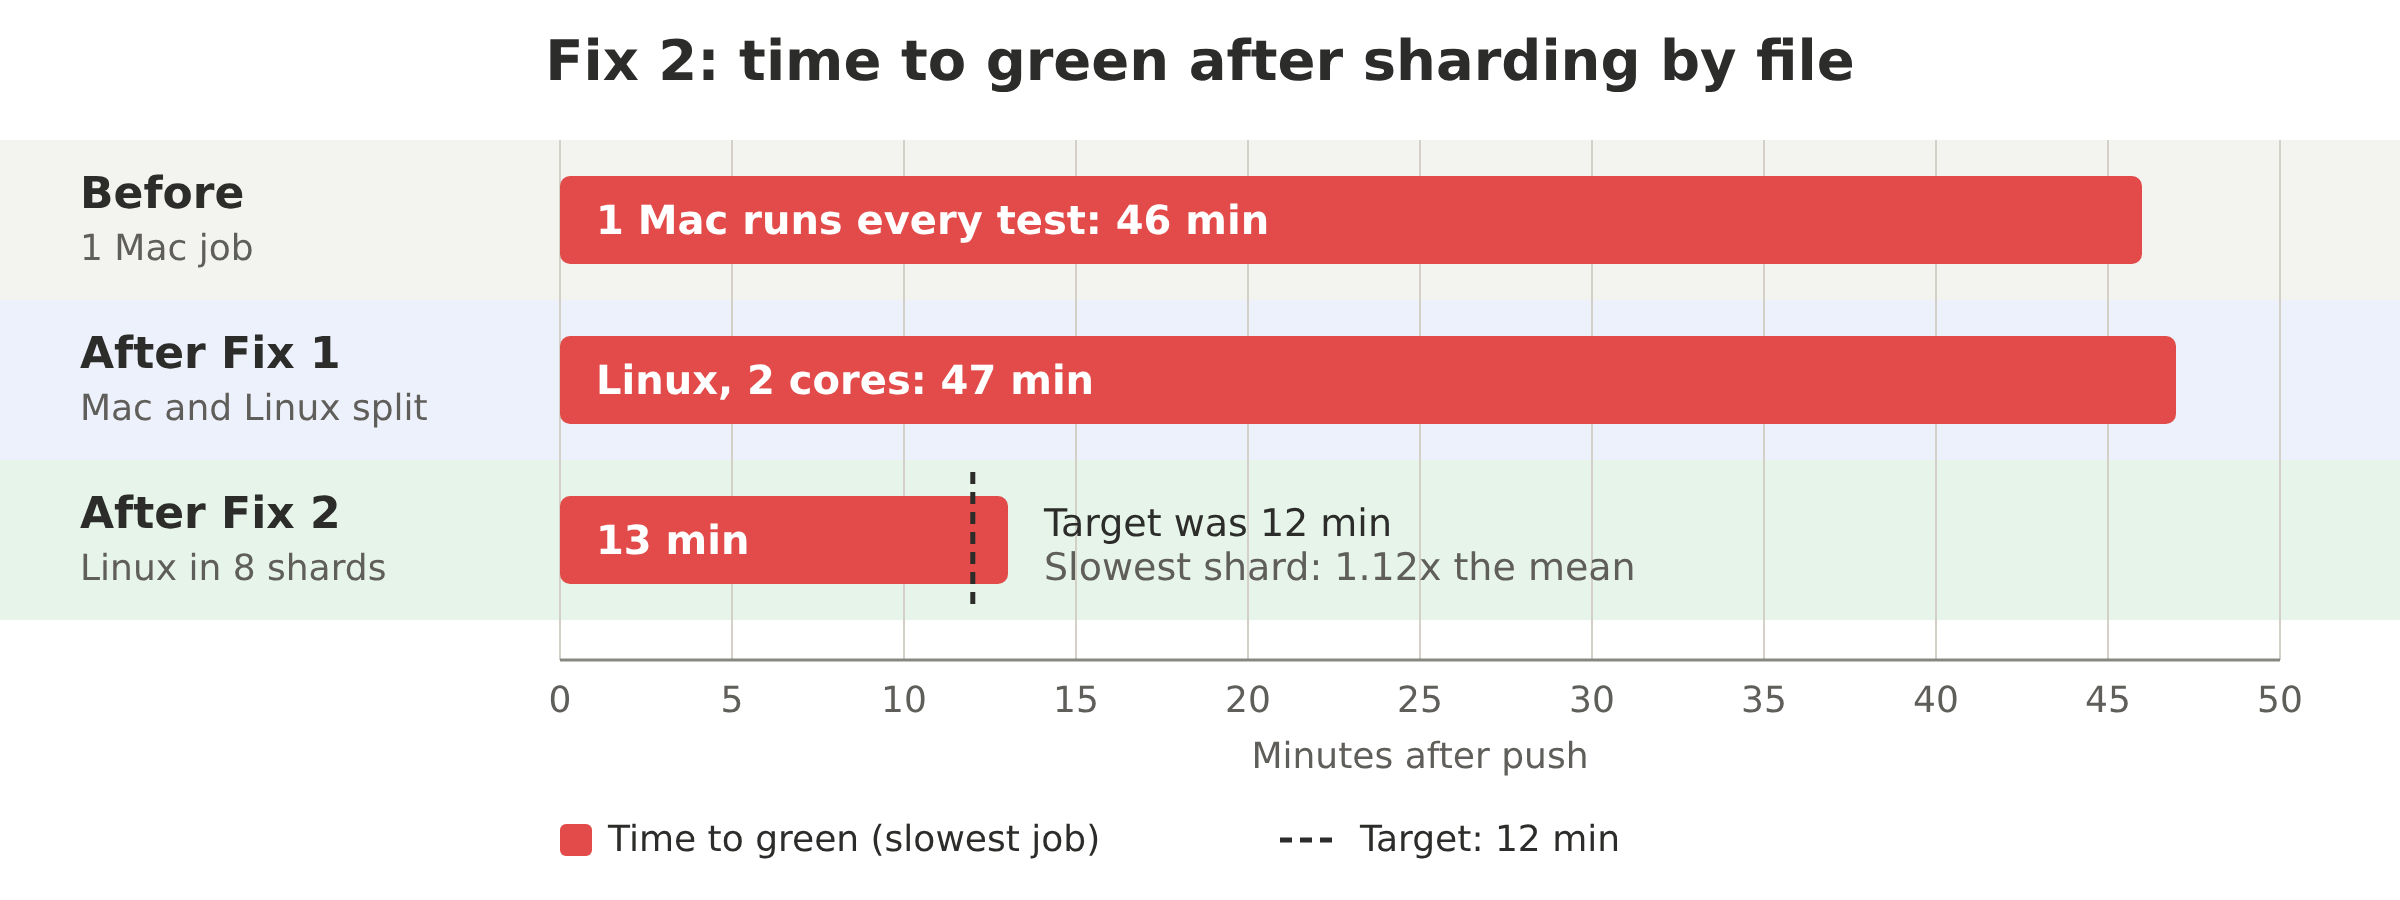
On its own, this saved nothing. Time to green is the slower of the two jobs, and the Linux half took 47 minutes, about the 46 we started with. A 2-core Linux runner was also about 1.9 times slower per file than the Mac: 2.8 seconds per file against 1.5.
What it gave us was a smaller problem. The Mac job dropped from 46 minutes to 13, and the only work left on a Mac was work that needs one. The Linux half became the new bottleneck, and the golden half now had a 13-minute floor. Both fed into Fix 2.
Fix 2: Shard by file
After Fix 1, the longest job was 47 minutes, so the next step was spreading that work across machines.
What’s a shard?
A shard is one slice of the test files (a group of test files), run on its own machine in parallel with the others.
We split by file, not by test. “What didn’t work” explains why.
A small script takes a text file that lists the test files, the total shard count, and this shard’s index, then prints the files that shard should run. Fix 1 plugs in through the list: the golden files go to the Mac jobs and everything else to the Linux jobs. At first we had no timings, so every file counted the same, and the script came down to one line:
# shard_files.sh <file-list> <shard-count> <shard-index>
sort "$1" | awk -v n="$2" -v i="$3" '(NR - 1) % n == i'
It sorts the list, then keeps every Nth line, where N is the number of shards, starting at the shard’s index. Every shard sorts the same list, so they agree without talking to each other.
Think of dealing cards: each shard gets one file in turn, and the deal wraps around. With 3 shards and 12 files, shard 0 gets files 1, 4, 7 and 10, shard 1 gets 2, 5, 8 and 11, and shard 2 gets 3, 6, 9 and 12. Every file lands in exactly one shard.
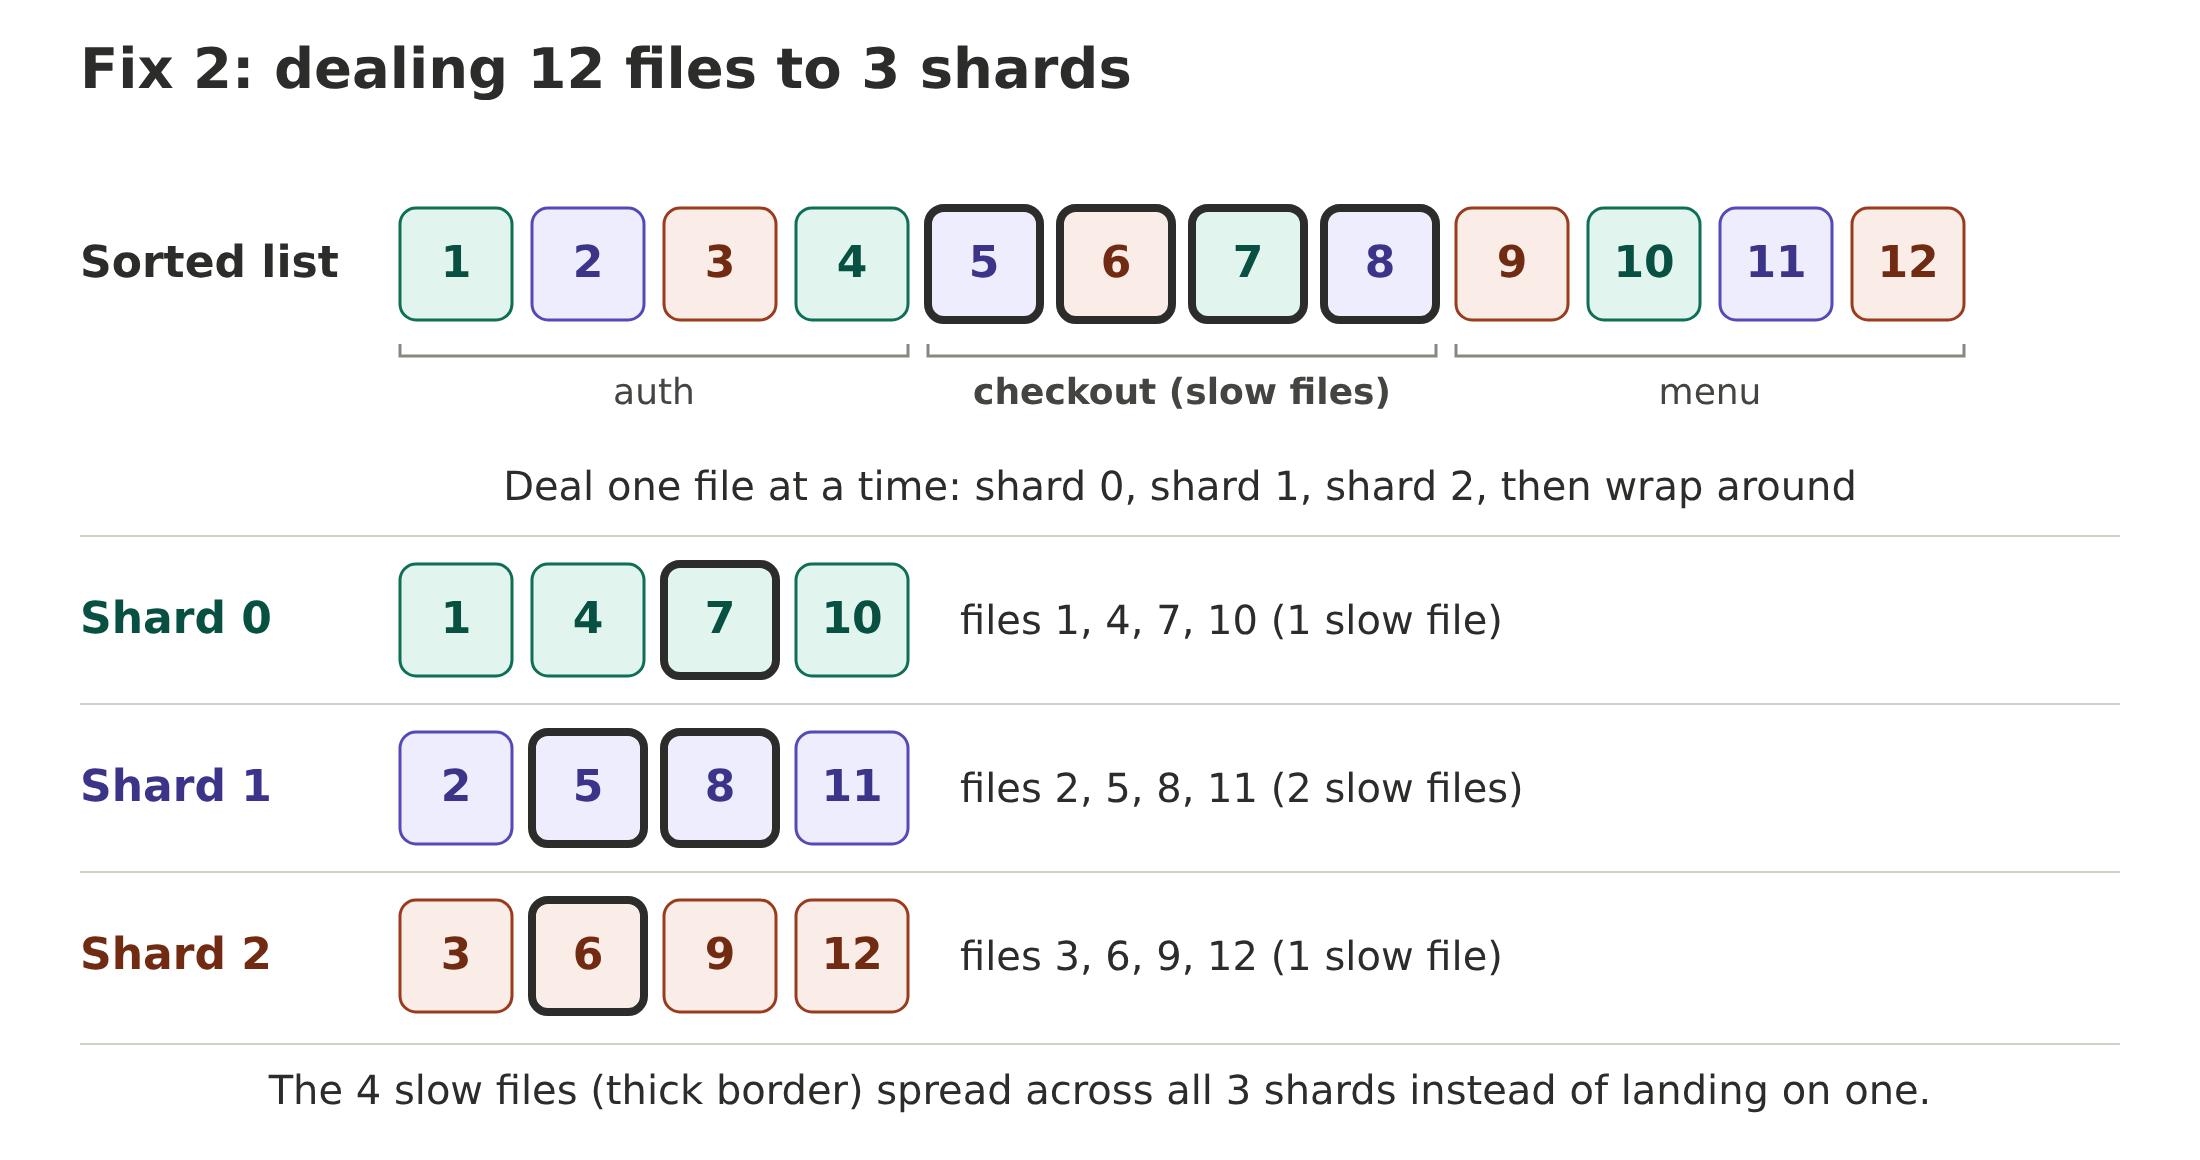
We deal the files out instead of handing each shard a block (files 1 to 4, then 5 to 8, and so on) because the list is sorted by path, so neighbouring files usually sit in the same folder. Files in one folder tend to be similarly slow, and a block could put all the slow ones on one shard. Dealing spreads every folder across all the shards.
Each shard runs one command:
flutter test --coverage $(scripts/ci/shard_files.sh files.txt 10 "$SHARD")
Every major provider can fan one job out into N copies and hand each copy its index. GitHub Actions calls it a matrix, GitLab CI has parallel, and CircleCI has parallelism.
We tested it the same way as Fix 1: a throwaway branch, the real runners, and no change to the main pipeline until the numbers held up. With 8 Linux shards, time to green was 13 minutes, down from 47. The slowest shard took 1.12 times the mean, under our limit of 1.3, so even a plain split came out close to balanced. But 13 minutes was still above our target of 12.
Picking the shard count took some tuning. More shards means fewer files per machine, so each one finishes sooner. But every shard also pays a fixed setup cost, such as downloading Flutter and fetching packages, so each extra shard buys less. We wanted the whole check under 12 minutes, and we had two groups of files to size.
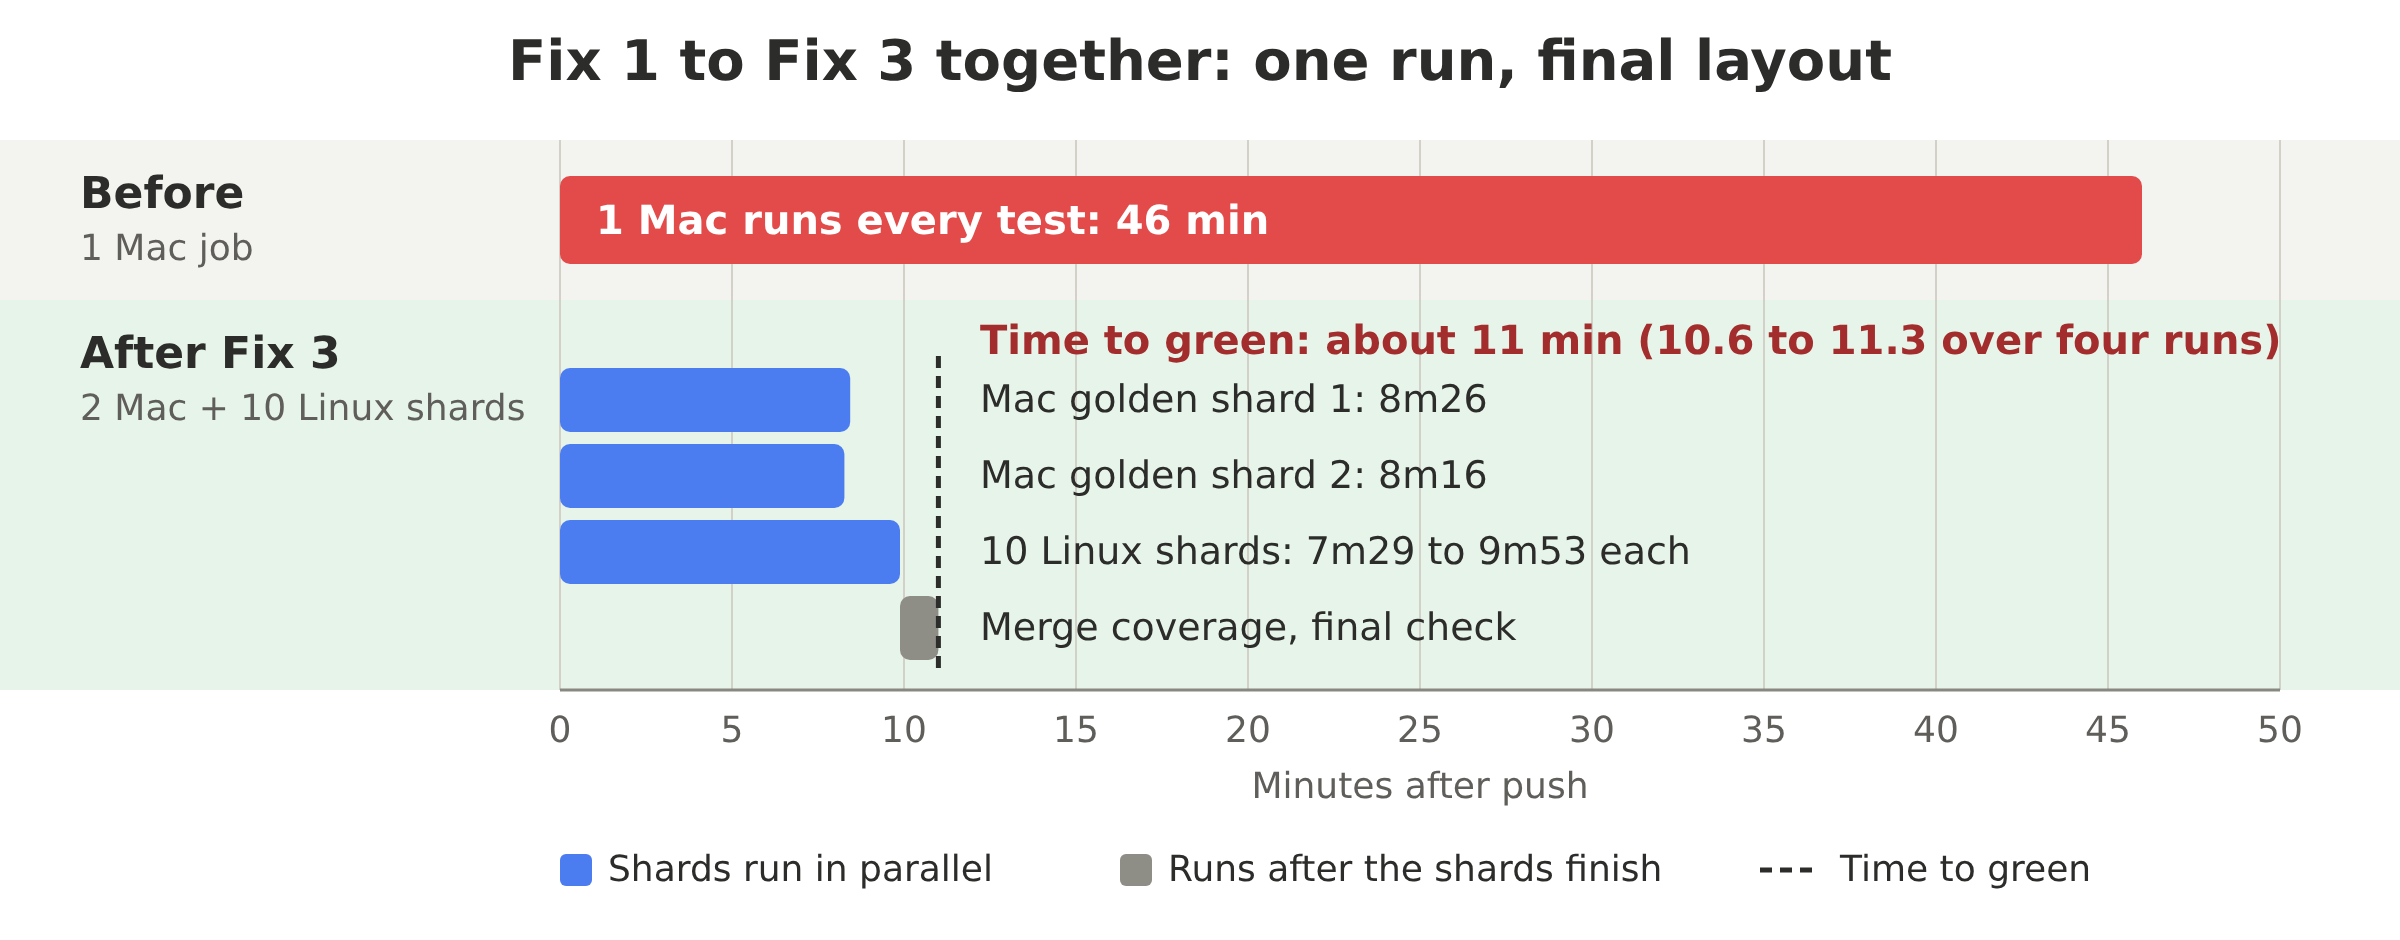
For the Linux files, we projected that 8 shards would finish in about 8 minutes each. That projection came from a run without coverage, which records which lines of code the tests ran. With coverage turned on, the shards ran about 30% slower than projected, and 8 shards no longer fit the target. Going to 10 shards gave each machine fewer files, which won back the slowdown.
For the golden files, the problem was on the Mac side. In Fix 1, a single Mac job took 13 minutes, so even if every other job were instant, that one job would keep the check above 12 minutes. We split the golden files across 2 Mac jobs, which now finish in about 8 and a half minutes each.
A final Linux job depends on every shard. It merges the coverage files and reports one aggregate check, still named tests. That is the only required check, so branch protection rules don’t change when the shard count does.
Fix 3: Balance the shards by recorded time
An even split by file count assumes every file takes the same time, and they don’t. At 1.12 times the mean, our slowest shard was already close, so the question was how much of the remaining gap recorded timings could close.
I took the idea from Flank, a test runner for Firebase Test Lab. Its smart sharding reads test durations from the previous run and groups tests into buckets of equal total time. Flank runs Android and iOS tests on Firebase Test Lab, and ours run on ordinary CI runners, so we kept the idea and wrote our own version that works per file.
We also read the durations from a different place. Flank uses the previous run. We keep per-file times in a JSON file that a scheduled job refreshes once a week, and every run in between reads that same file.
Here is a simplified version in Python. Ours is the same loop written in jq:
# usage: python shard.py files.txt timings.json 10 3
import json, sys

list_file, timings_file, total, index = sys.argv[1:5]
total, index = int(total), int(index)

files = open(list_file).read().split()
timings = json.load(open(timings_file))          # {"test/a_test.dart": 4.2, ...}
median = sorted(timings.values())[len(timings) // 2]

shards = [[] for _ in range(total)]
load = [0] * total
for f in sorted(files, key=lambda f: (-timings.get(f, median), f)):
    lightest = load.index(min(load))
    shards[lightest].append(f)
    load[lightest] += timings.get(f, median)

print("\n".join(shards[index]))
The loop takes the slowest file first and puts it on whichever shard has the least total time so far. A file with no recorded time counts as the median. Every shard runs the same loop and prints only its own part, so nothing needs coordinating. The shard command gains one argument, the timings file.
With the timings file, the slowest shard sat between 1.02 and 1.11 times the mean, against 1.12 without it. That’s a smaller gain than I expected. Runs ranged from 11.4 to 15.4 minutes while we tuned, then settled. After tuning, the Linux shards finished between 7m29 and 9m53, and the two Mac golden shards in about 8m26 and 8m16. Time to green was 10.6 to 11.3 minutes over four runs.
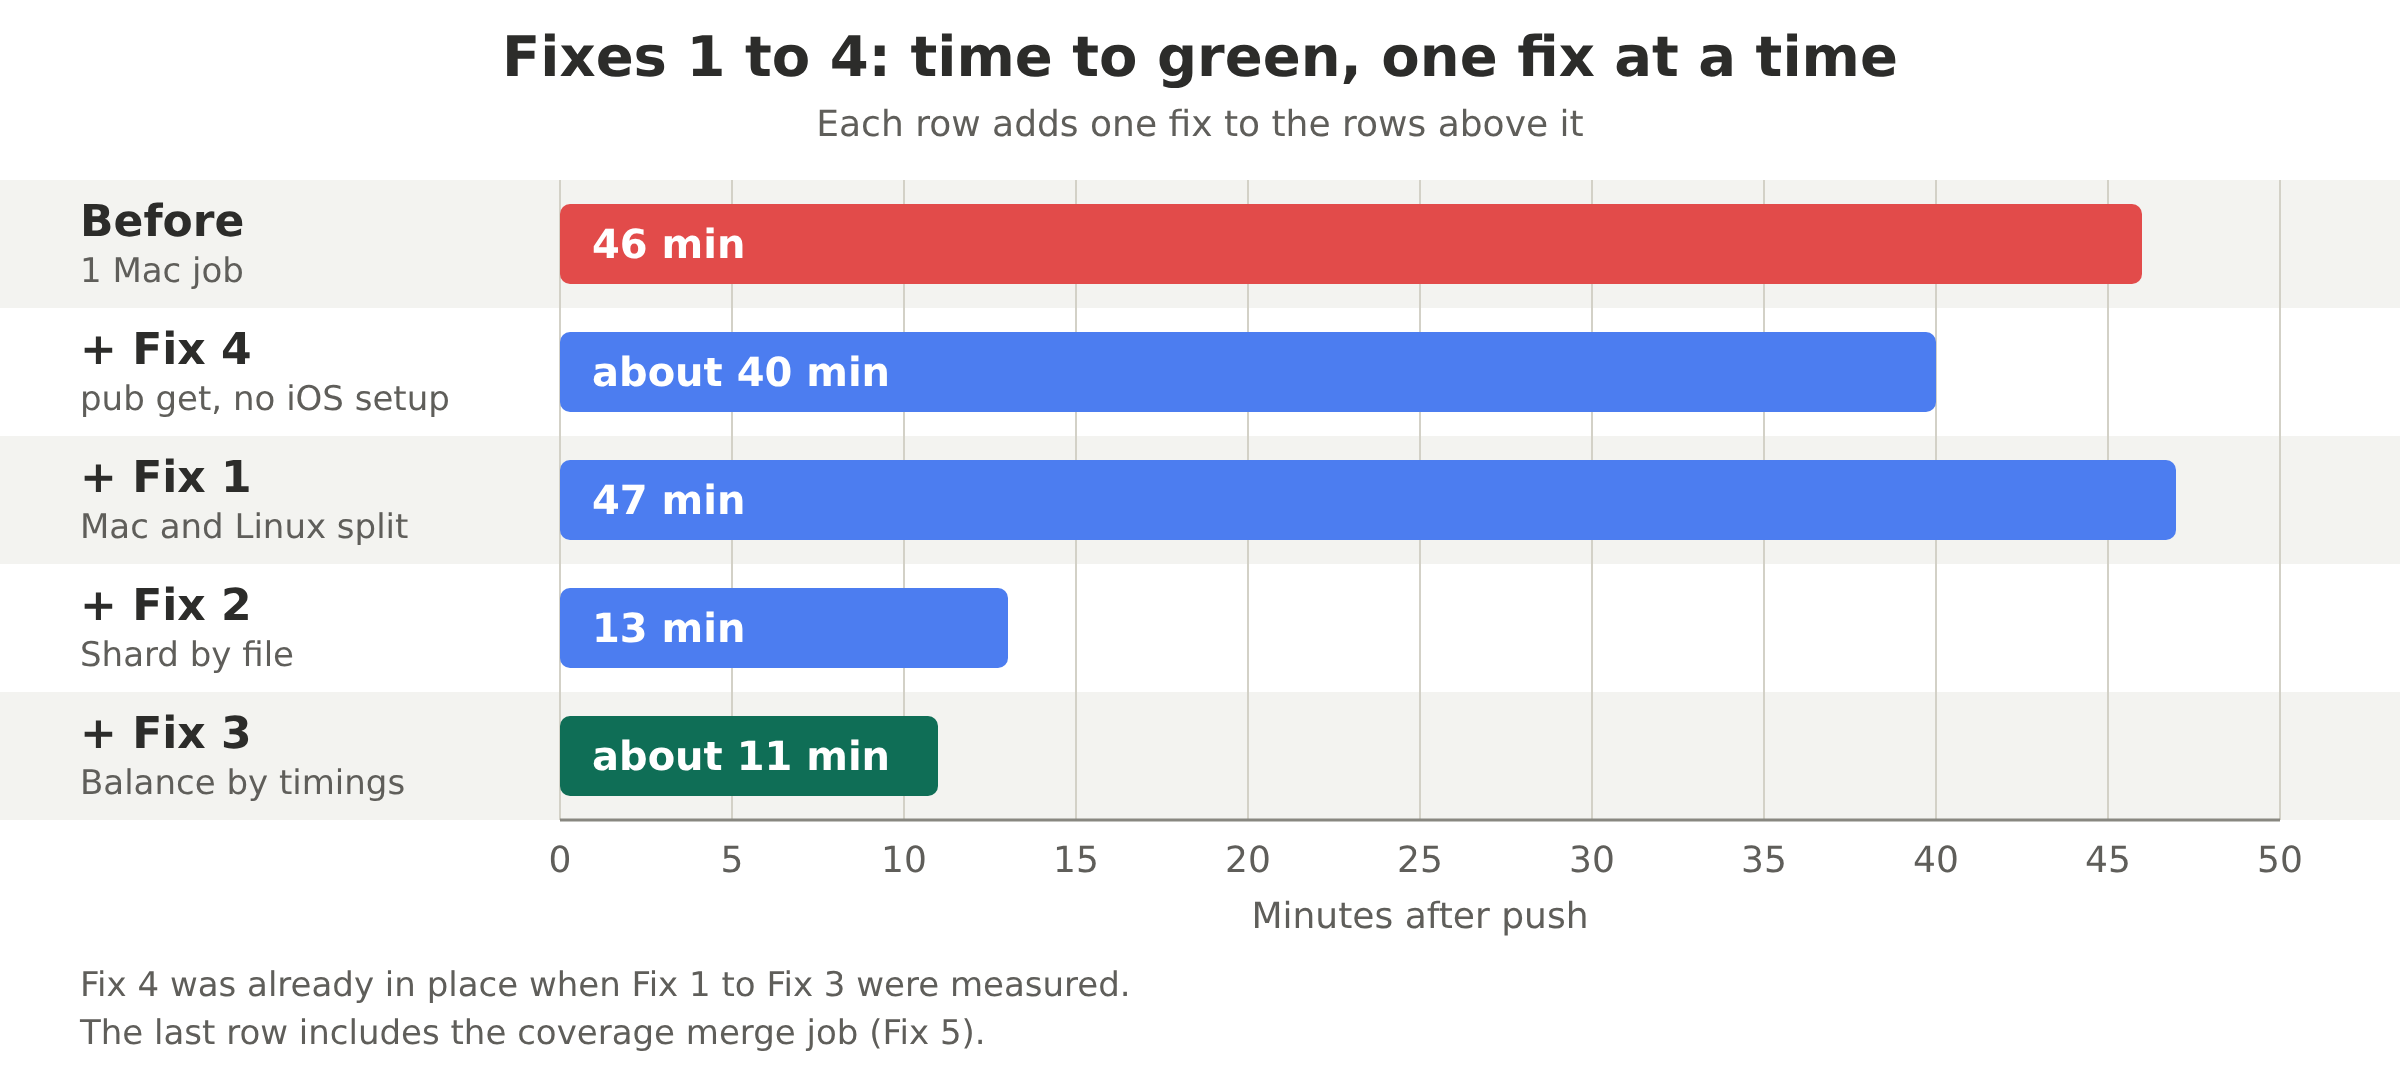
I can’t say how many of the minutes between 13 and 11 came from the timings and how many from going from 8 shards to 10, because both changed in the same runs.
Fix 4: Stop installing iOS tools the tests don’t use
The prepare step ran a shared script that does pub get, flutter precache --ios, and pod install --repo-update. In one sampled log, pod install alone took 4 min 29 s, mostly refreshing the CocoaPods spec repository. Over the 30-day window, the step used 1,947 Mac minutes.
flutter test runs on the host, not on an iOS simulator, and never touches pods. The best evidence we had: the Tests job ran for three and a half years with a prepare step that was only pub get. Someone added the pod install and the precache later, for reasons that had nothing to do with the tests.
The fix is one line in the pipeline configuration:
flutter pub get
What didn’t work
Flutter’s
--total-shards. It sounds like the right tool for this problem, but it splits the tests inside each file, so every shard still compiles and boots all 1,450 files. Locally, shard 0 of 4 took 21 min 05 s, longer than the whole suite run unsharded (12 min 09 s).Bundling test files. This was the fastest idea we tried, and the one I would most like to ship. We shelved it because it made the results unreliable. The idea: generate entry files that import 50 test files each, so each bundle compiles and boots once. Locally the full suite dropped from 12 min 09 s to 2 min 12 s. On CI with coverage, the test step took about 6 minutes against 35.8. The catch is that files in one bundle share a single isolate, so state left behind by one file can break the next. A first try on 150 files in 3 bundles took 1,066 seconds, and 98 files failed, against 123 seconds and zero failures when run separately. The cause was process-wide state that survives from one file to the next: Flutter’s
rootBundleasset cache, a static map with a one-minute clock-based expiry, and several_isDialogShowingflags on error dialogs. We wrote reset hooks and got the 150 files down to 2 failures. That still wasn’t enough. We ran the tests in random order on CI across 5 seeds, and 44 distinct files (3.0%) failed. Every seed found new ones, and adding files to an ignore list never converged. A required check that fails on different files from run to run blocks merges for reasons unrelated to the change, so we kept the slower setup, where a green check means the tests passed. I still don’t know why two of those bundled files time out. One of them makes an unmocked POST request, which looks like the same race, but we never traced it. We also found several tests that pass only because an unmocked request happens to fail at a lucky moment. Those are going to the teams that own them.
Result
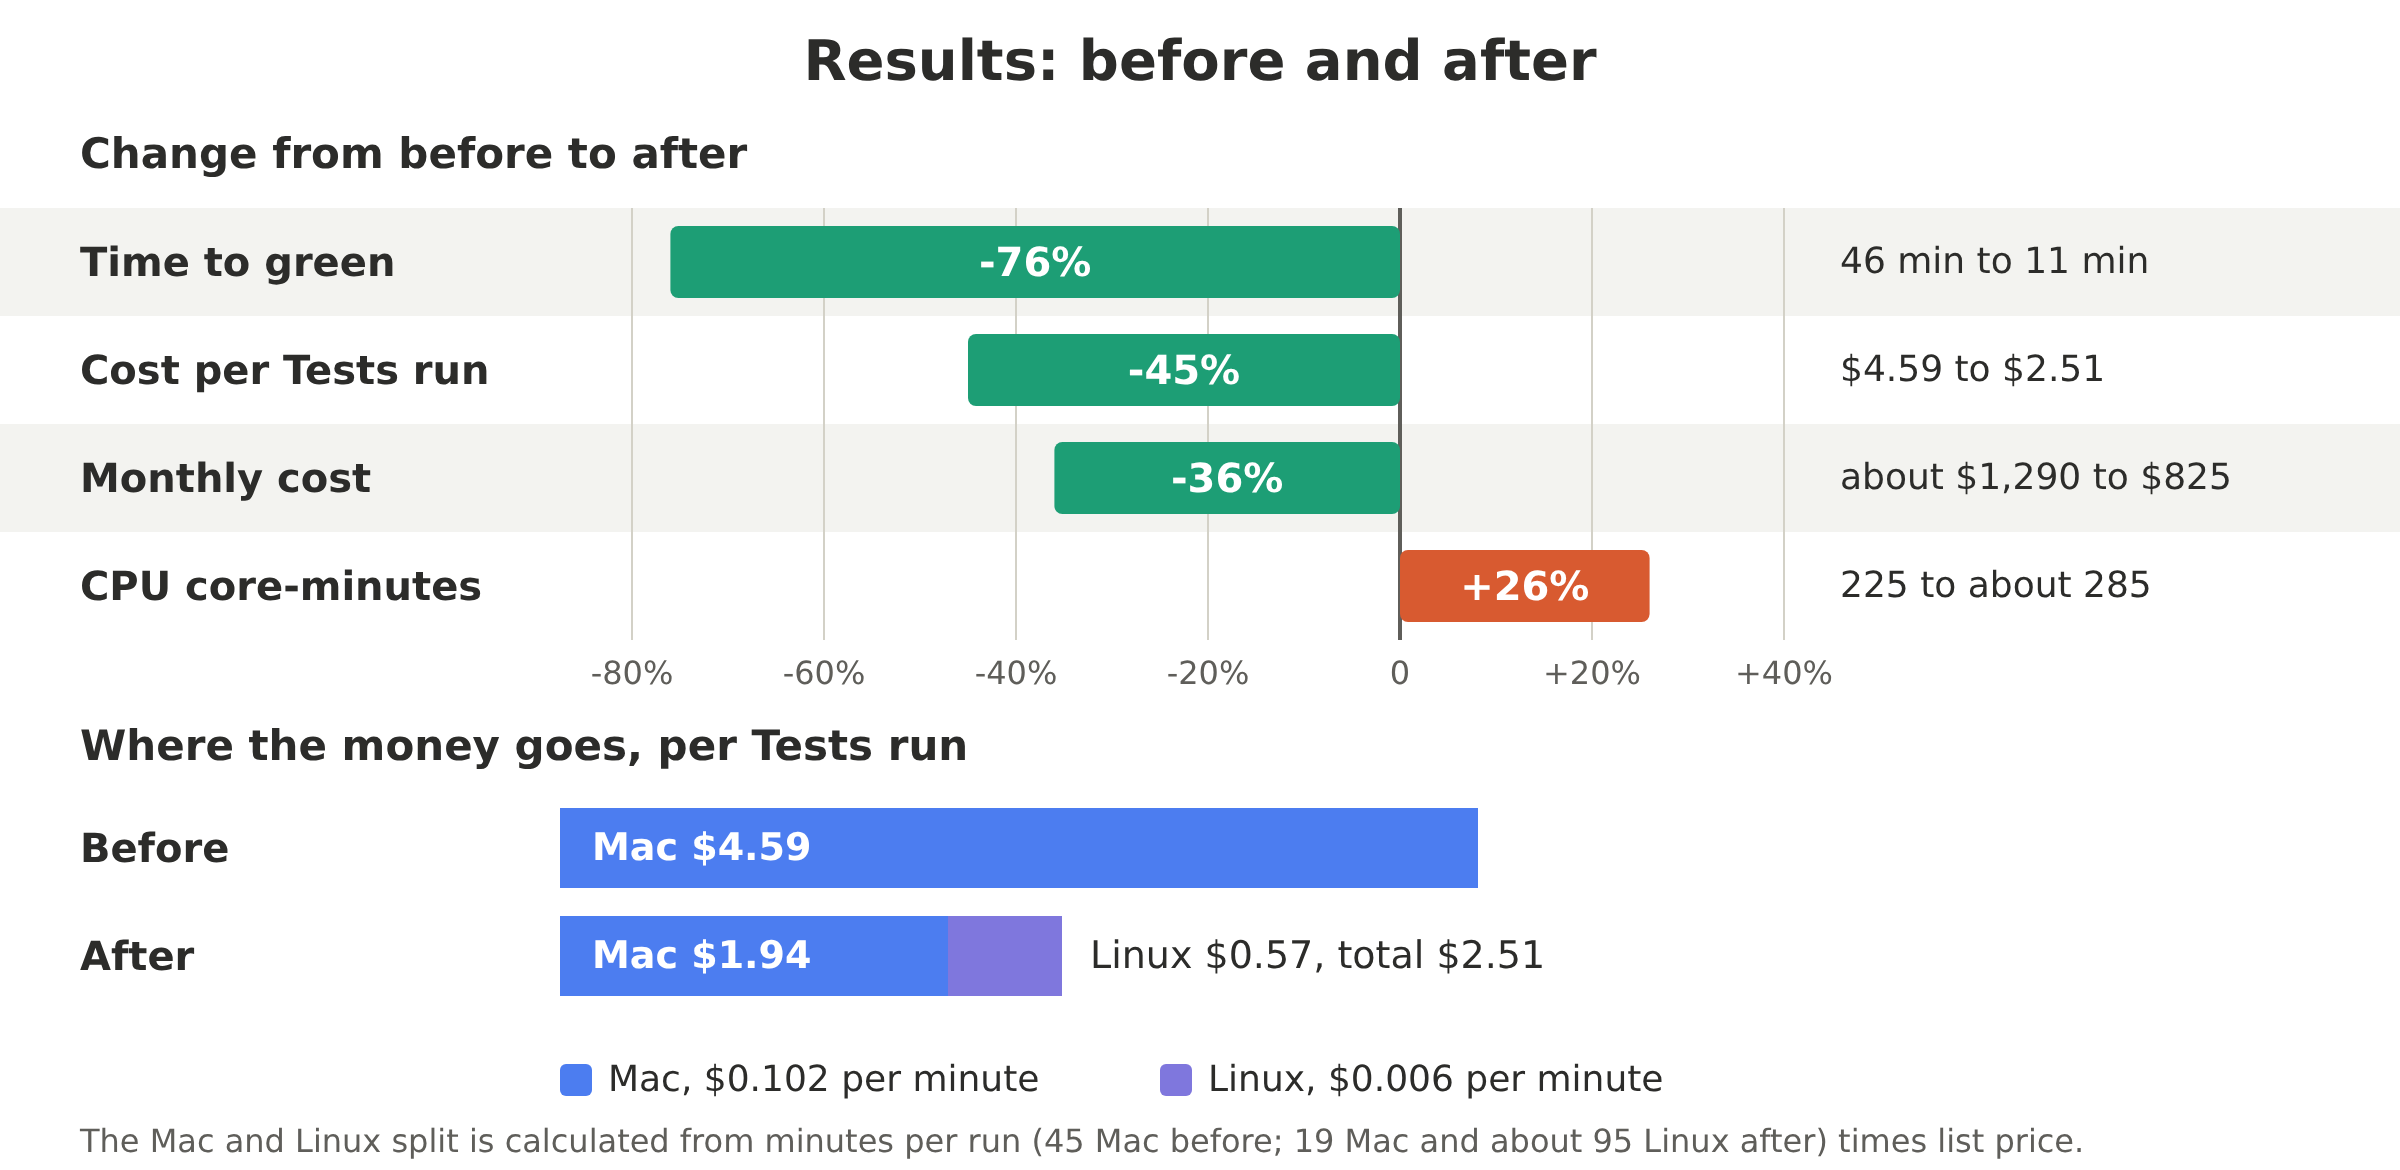
| Metric | Before | After |
|---|---|---|
| Time to green (one pull request) | about 46 min | 11 min 21 s |
| Tests check | 46 min | 10.6 to 11.3 min (4 runs) |
| Mac jobs per push | 1 | 2 |
| Mac minutes per run | 45 | 19 |
| Linux minutes per run | 0 | about 95 |
| CPU core-minutes per run | 225 | about 285 |
| Cost per Tests run | $4.59 | $2.51 |
Time dropped about 76%. Cost per run dropped 45%, and monthly cost dropped 36%. Those are three different numbers, and the gaps have two causes.
CPU time went up 26%. Twelve machines each repeat a little setup, such as downloading Flutter and fetching packages, and each one boots its own share of the test files. Money went down anyway because most of that CPU time now runs on Linux, where a minute costs 17 times less than on a Mac.
Apply this to your pipeline
- Pull per-step durations for 30 days of runs. Use medians and green runs only.
- Find the one or two steps that own most of the time. Don’t touch the rest yet.
- Read your setup steps and delete work the tests don’t use.
- Check what’s pinned to an expensive runner and why. Try the rest on a cheaper one.
- Shard by file, not with
--total-shards, and keep a single required check that waits for every shard. - Compare the slowest shard to the mean. If it’s well above 1.3 times, balance by recorded durations.
- Re-measure after each change, using the median of about 10 runs, not one.
- Price it in billed minutes, including cancelled runs.
Trade-offs and caveats
- Each push now holds 2 Macs at once. Providers usually cap concurrent macOS jobs by plan, and the cap on cheaper plans can be as low as 5. Check your own limit first.
- Cancelled runs cost more. See above. If your team cancels a lot, the savings shrink.
- The per-file timings file needs a scheduled job to refresh it once a week. Nothing breaks if it goes stale: new tests still run, and the shards drift out of balance slowly. With no timings at all, the slowest shard was 1.12 times the mean.
- Twelve jobs per run instead of one means more to read when something fails. Artifacts grew from about 8.1 MB to 9.3 MB per run.
- The golden tests stay on Mac. We haven’t measured whether Linux can render them within our comparison tolerance.
Takeaways
- The step that owned the time was one nobody would have blamed. Measure first.
- Delete work the tests don’t use before you parallelize anything.
- Shard by file, balance by recorded time, and skip
--total-shards. - Compare cost in billed minutes. Wall-clock time and money move independently.